We got a deadzone in SQL Server 2016 SP1 CU4. A small amount of testing on SQL Server 2016 SP1 CU3 indicates the deadzone behavior was introduced in CU4 and not earlier. Rather than re-generate a bunch of stuff I have from CU2 in CU3, though, for the sake of me finally getting something more info about this scenario into the blog-o-sphere, I'll be comparing the behavior of SP1 CU4 to SP1 CU2 here.
The deadzone... for hours, four deep sleepers and one nervous waker for a MAXDOP 2 query try to get it out... usually they do. But it can take hours... sometimes days.
My current theory as to what is happening: for some reason, the deadlock monitor is prompting the wrong producer at the exchange to spill. That producer wakes up... can't spill... so goes immediately back to sleep. After some indeterminate amount of time, the deadlock monitor finally prompts the right producer to spill - one that *can* spill. It does spill, and then the query progresses. What leads to the change in which thread gets kicked by the deadlock monitor to spill? I don't know... and not sure I can determine that without access to source code.
*****
Joe Obbish used a heading of "Putting the Dead in Deadlock" in his related blog post... I'm so impressed with that turn of phrase I have to try some of my own. :-) Joe's post is here...
Hash Partitioned Exchange Spills
https://orderbyselectnull.com/2017/09/15/hash-partitioned-exchange-spills/
And there is a Connect item...
Order Preserving Repartition Streams Can Cause Extreme Performance Degradations
https://connect.microsoft.com/SQLServer/feedback/details/3141119/order-preserving-repartition-streams-can-cause-extreme-performance-degradations
Let's start this adventure the way I started it: by looking at some frustrating behavior on SQL Server 2016 SP1 CU4. Below is the setup, followed by the troubled query. The table created in the setup is as simple as it gets: single column BIGINT, in a clustered index. 13890 zeroes inserted, followed by 13890 ones. Update stats on the clustered index before the first attempt at producing an egregious hang, so every execution is on a level playing field. Trace flag 8649 is used here so cost doesn't prevent a parallel plan. Hint the merge join to get order-preserving exchanges. The same problem occurs at higher DOP than 2... but when investigating a problem with parallel queries, I recommend working with the lowest DOP where the behavior can be reproduced for the sake of simplicity.
I've run the setup and the trouble query in a user database with 8 equally-sized data files, and in a single-file master database, with the same results. When the query is fast... its fast. But when its slow, it can take hours to complete. Sometimes days.
Here's live query stats from an example - in fact one that's running as I'm typing in this post.

As I was running these tests, I made sure that "live query stats" and "include actual plan" were toggled on for my session. So sys.dm_exec_query_profiles info was available for the session.

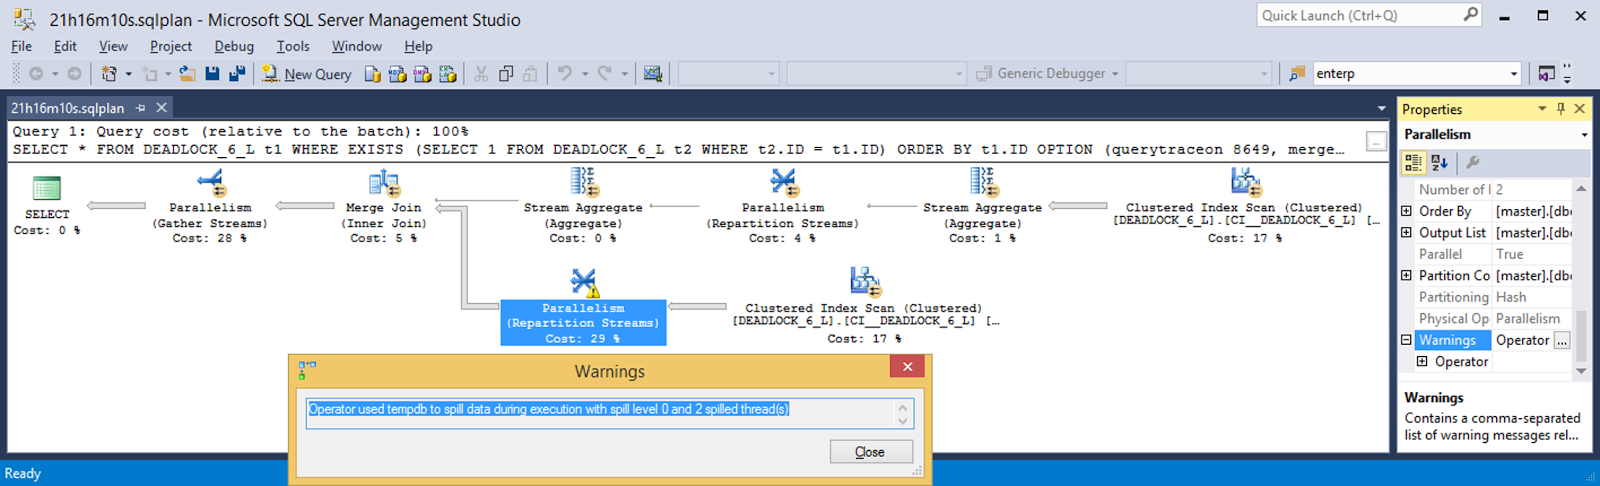
Whew!! That one finally completed. 21 hours, 16 minutes, 10 seconds as reported by SSMS.

Lets take a look at that post-execution plan for clues. There's a warning on the Repartition Streams - what's it say?
OK, what about the waits recorded by the post-execution plan? Huh. That's a total of only 176 ms of wait time. 4071 ms of CPU time. And 76569190 ms of elapsed time (21h16m9s190ms). That doesn't add up in any way, shape, or form.

What does sys.dm_exec_session_wait_stats say? *That* makes more sense. 306270624 ms of CXPACKET wait time. 85h6m30s624ms among the 5 threads that last long enough to be observed.

The deadzone... for hours, four deep sleepers and one nervous waker for a MAXDOP 2 query try to get it out... usually they do. But it can take hours... sometimes days.
My current theory as to what is happening: for some reason, the deadlock monitor is prompting the wrong producer at the exchange to spill. That producer wakes up... can't spill... so goes immediately back to sleep. After some indeterminate amount of time, the deadlock monitor finally prompts the right producer to spill - one that *can* spill. It does spill, and then the query progresses. What leads to the change in which thread gets kicked by the deadlock monitor to spill? I don't know... and not sure I can determine that without access to source code.
*****
Joe Obbish used a heading of "Putting the Dead in Deadlock" in his related blog post... I'm so impressed with that turn of phrase I have to try some of my own. :-) Joe's post is here...
Hash Partitioned Exchange Spills
https://orderbyselectnull.com/2017/09/15/hash-partitioned-exchange-spills/
And there is a Connect item...
Order Preserving Repartition Streams Can Cause Extreme Performance Degradations
https://connect.microsoft.com/SQLServer/feedback/details/3141119/order-preserving-repartition-streams-can-cause-extreme-performance-degradations
Let's start this adventure the way I started it: by looking at some frustrating behavior on SQL Server 2016 SP1 CU4. Below is the setup, followed by the troubled query. The table created in the setup is as simple as it gets: single column BIGINT, in a clustered index. 13890 zeroes inserted, followed by 13890 ones. Update stats on the clustered index before the first attempt at producing an egregious hang, so every execution is on a level playing field. Trace flag 8649 is used here so cost doesn't prevent a parallel plan. Hint the merge join to get order-preserving exchanges. The same problem occurs at higher DOP than 2... but when investigating a problem with parallel queries, I recommend working with the lowest DOP where the behavior can be reproduced for the sake of simplicity.
/* the setup: drop/create a single BIGINT column table w/CI
              populate the table with 13890 0s and 13890 1s */
DROP TABLE IF EXISTS DEADLOCK_6_L
CREATE TABLE DEADLOCK_6_L(ID BIGINT);
CREATE CLUSTERED INDEX CI__DEADLOCK_6_L ON DEADLOCK_6_L(ID);

INSERT INTO DEADLOCK_6_L SELECT 0 FROM
(SELECT TOP (13890) row_number() over(order by (select null)) RN
 FROM master..spt_values t1 CROSS JOIN master..spt_values t2) subQ;

INSERT INTO DEADLOCK_6_L SELECT 1 FROM
(SELECT TOP (13890) row_number() over(order by (select null)) RN
 FROM master..spt_values t1 CROSS JOIN master..spt_values t2) subQ;

UPDATE STATISTICS DEADLOCK_6_L(CI__DEADLOCK_6_L) WITH FULLSCAN;

/* might take up to 20 repetitions of the query below
   to get exchange spill (CU2) or "the deadzone" (CU4) */

SELECT * FROM DEADLOCK_6_L t1 WHERE EXISTS
(SELECT 1 FROM DEADLOCK_6_L t2 WHERE t2.ID = t1.ID)
ORDER BY t1.ID OPTION (querytraceon 8649, merge join, maxdop 2);
I've run the setup and the trouble query in a user database with 8 equally-sized data files, and in a single-file master database, with the same results. When the query is fast... its fast. But when its slow, it can take hours to complete. Sometimes days.
Here's live query stats from an example - in fact one that's running as I'm typing in this post.
As I was running these tests, I made sure that "live query stats" and "include actual plan" were toggled on for my session. So sys.dm_exec_query_profiles info was available for the session.
Whew!! That one finally completed. 21 hours, 16 minutes, 10 seconds as reported by SSMS.
Lets take a look at that post-execution plan for clues. There's a warning on the Repartition Streams - what's it say?
OK, what about the waits recorded by the post-execution plan? Huh. That's a total of only 176 ms of wait time. 4071 ms of CPU time. And 76569190 ms of elapsed time (21h16m9s190ms). That doesn't add up in any way, shape, or form.
What does sys.dm_exec_session_wait_stats say? *That* makes more sense. 306270624 ms of CXPACKET wait time. 85h6m30s624ms among the 5 threads that last long enough to be observed.
No comments:
Post a Comment